Commission contexts
For briefs where data is not a dashboard appendix but the material of the work. For the studio definition, read What Is Data Art?
Complex structure needs public form
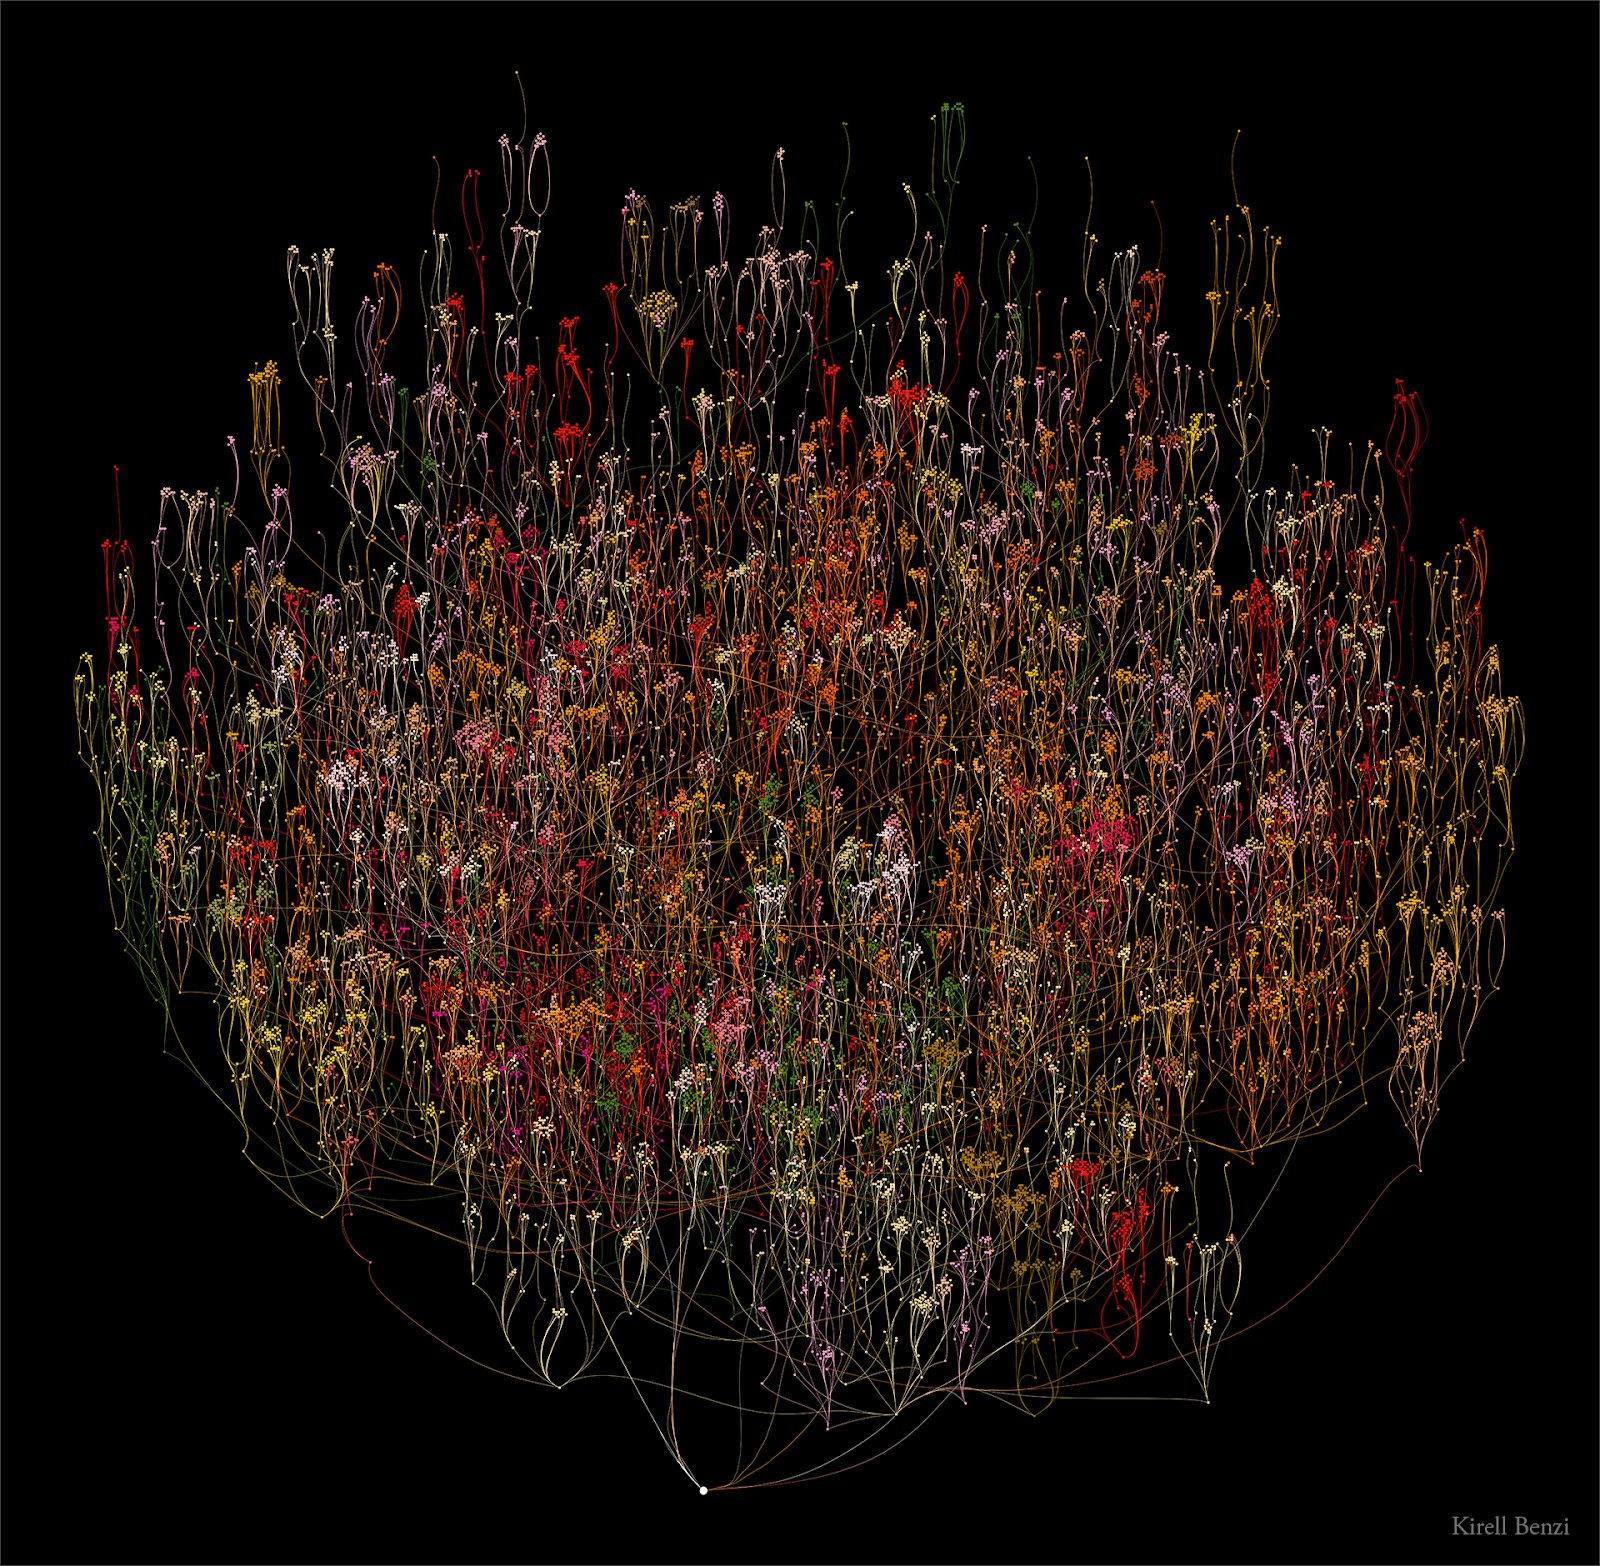
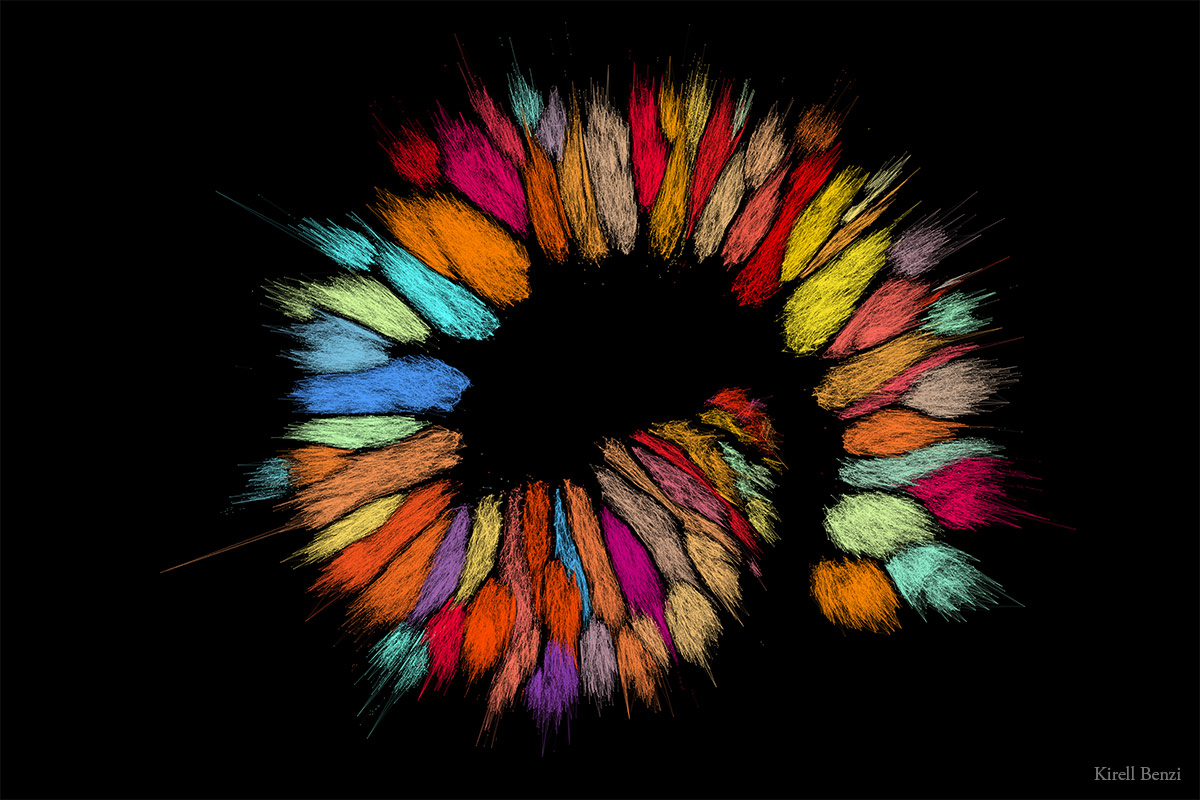
Networks, scientific measurements, cultural collections, biometric signals, and spatial data can carry meaning that ordinary charts flatten or hide.
The image has to carry the system
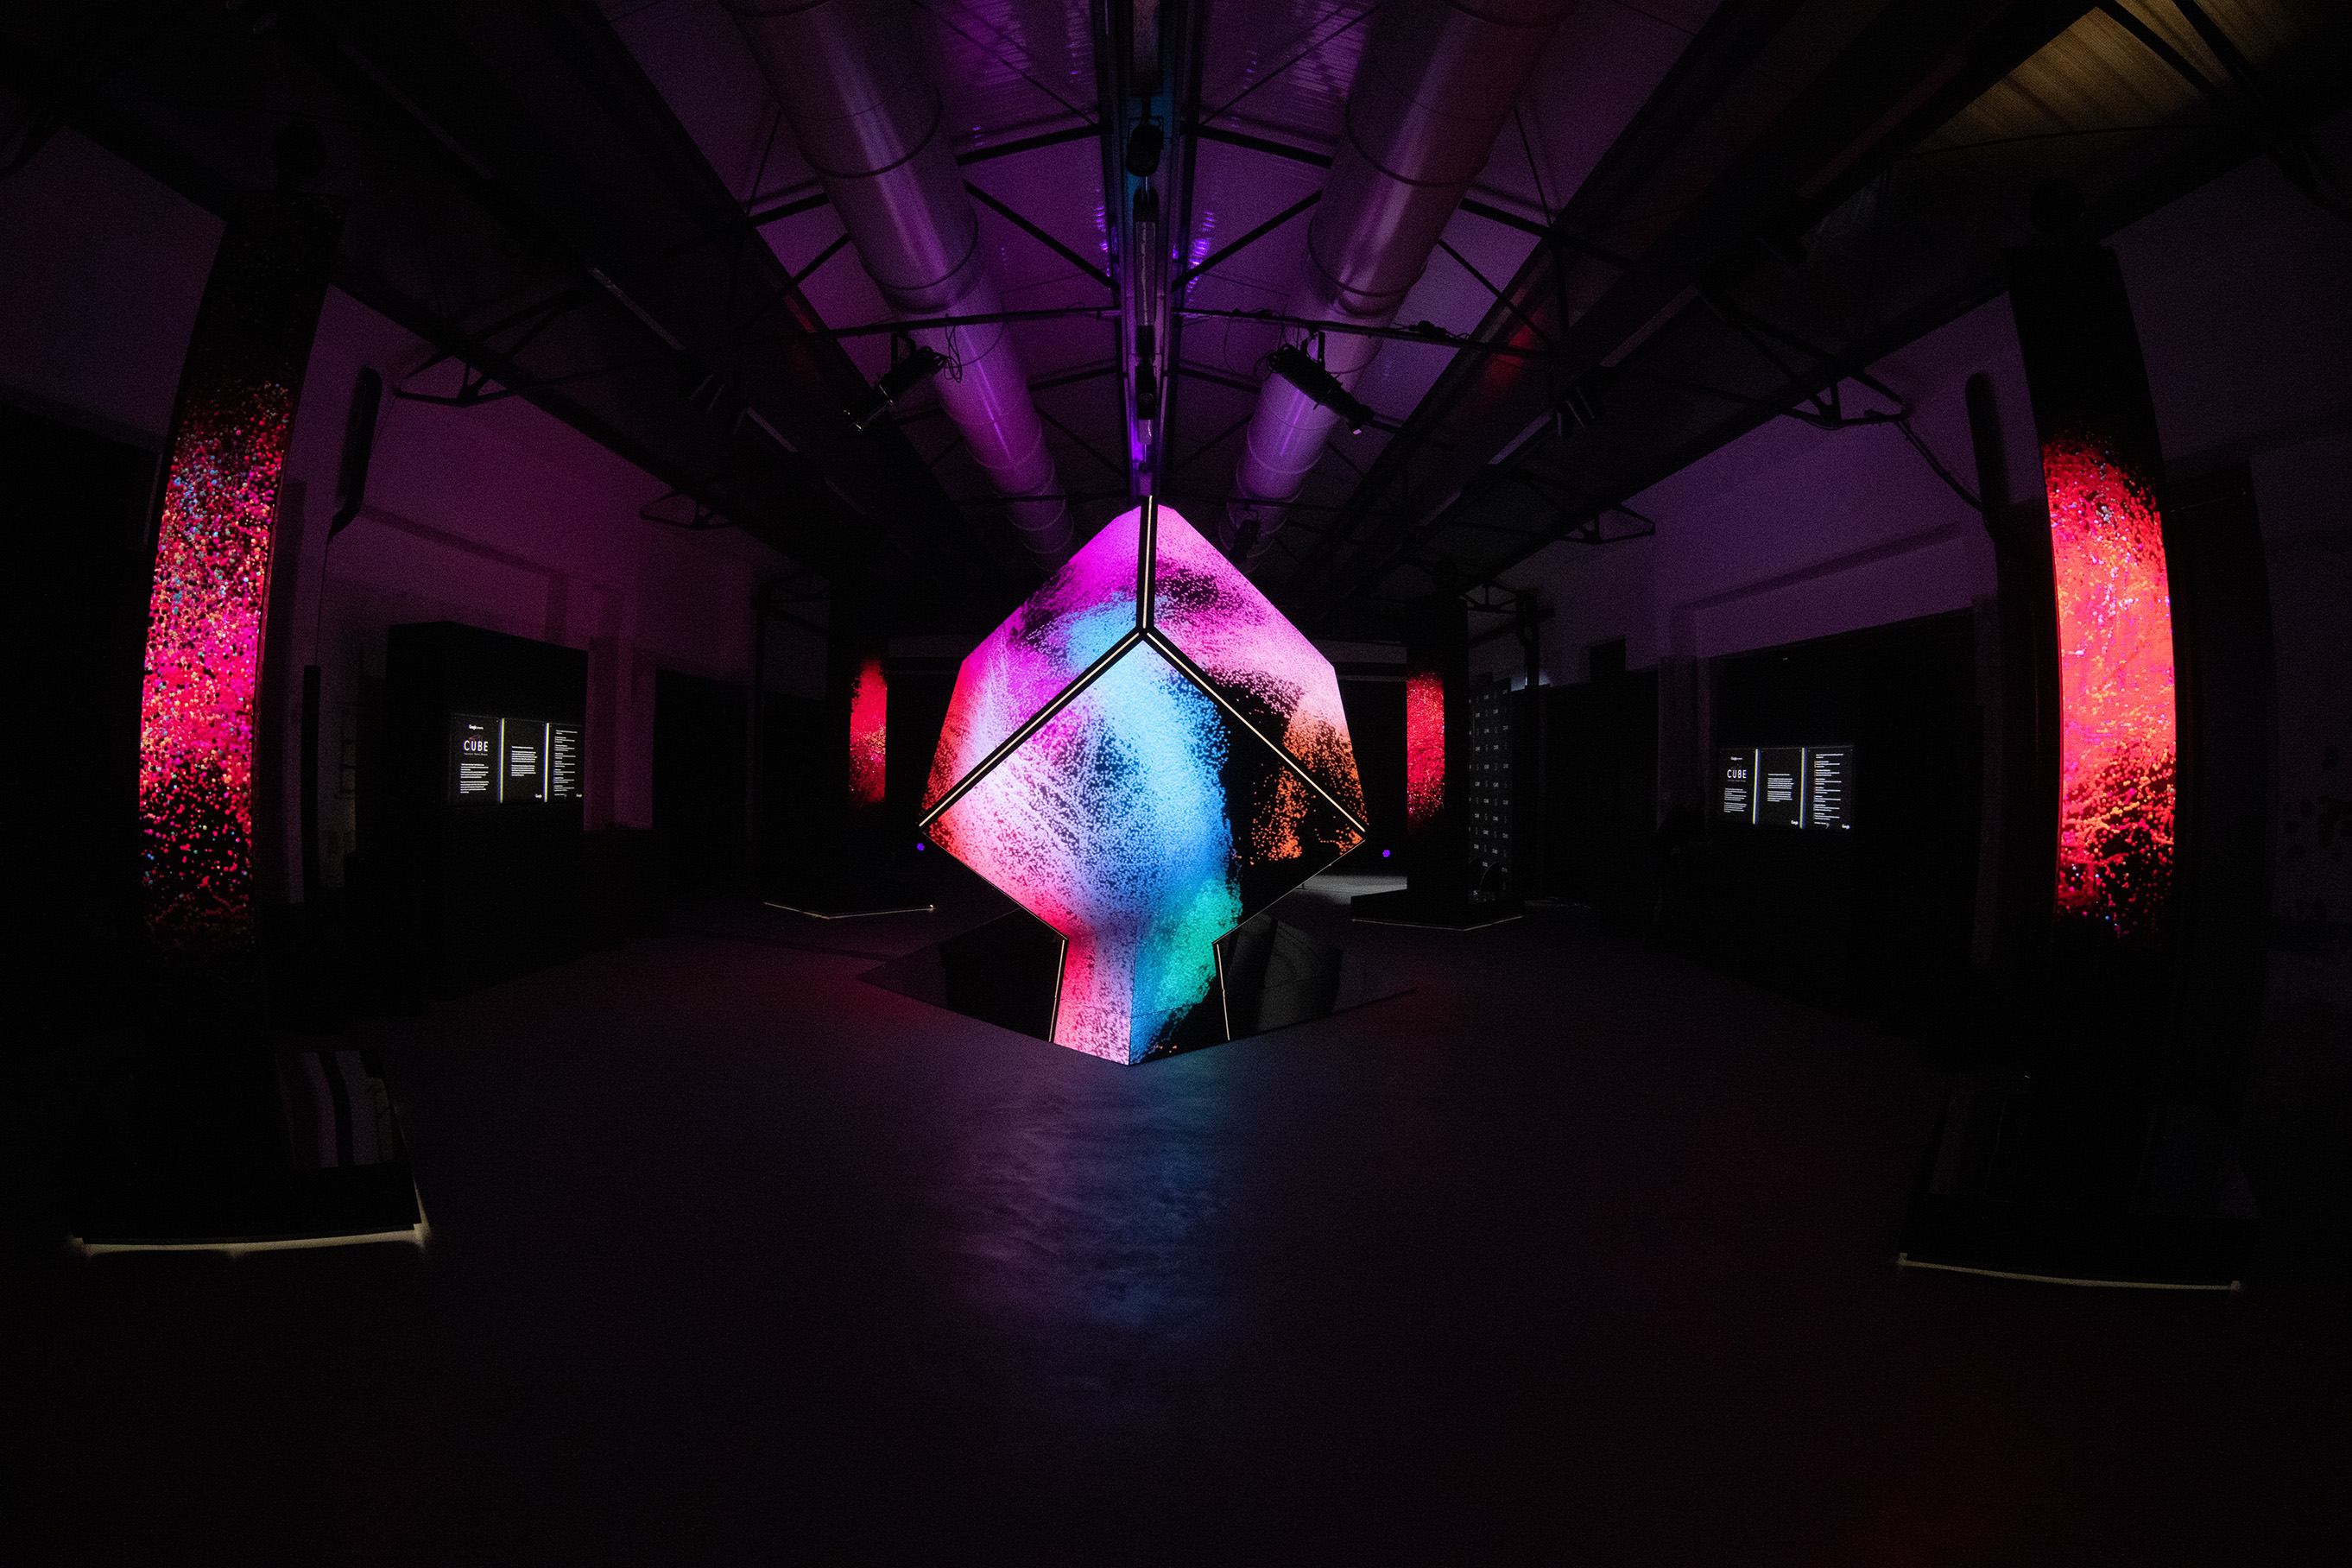
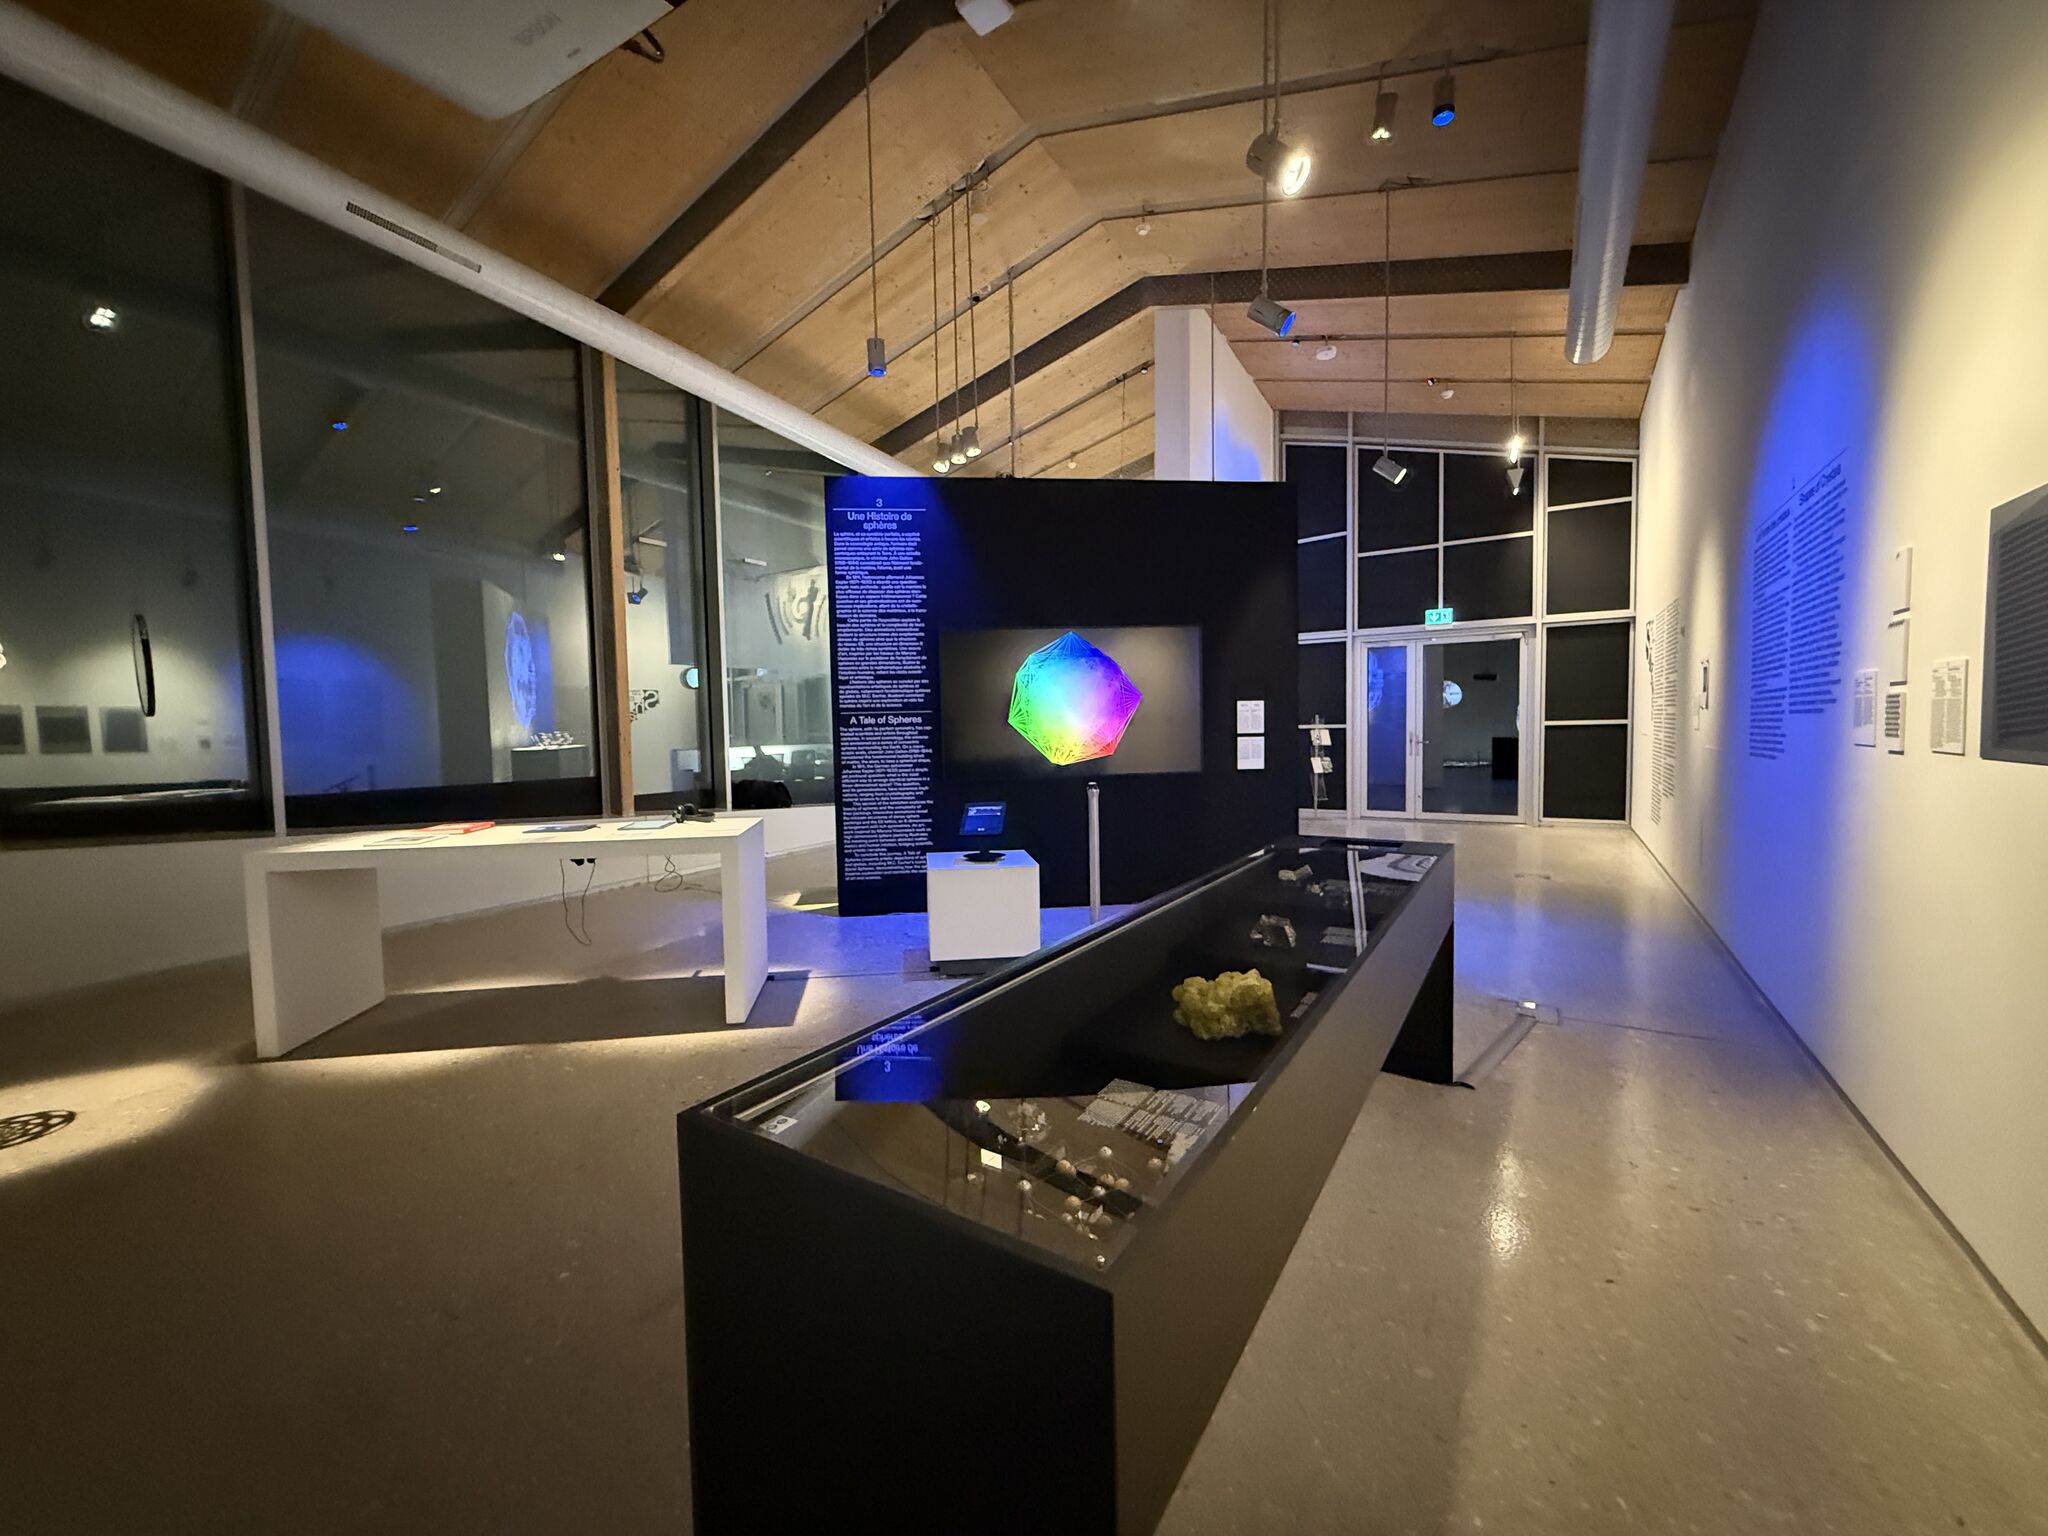
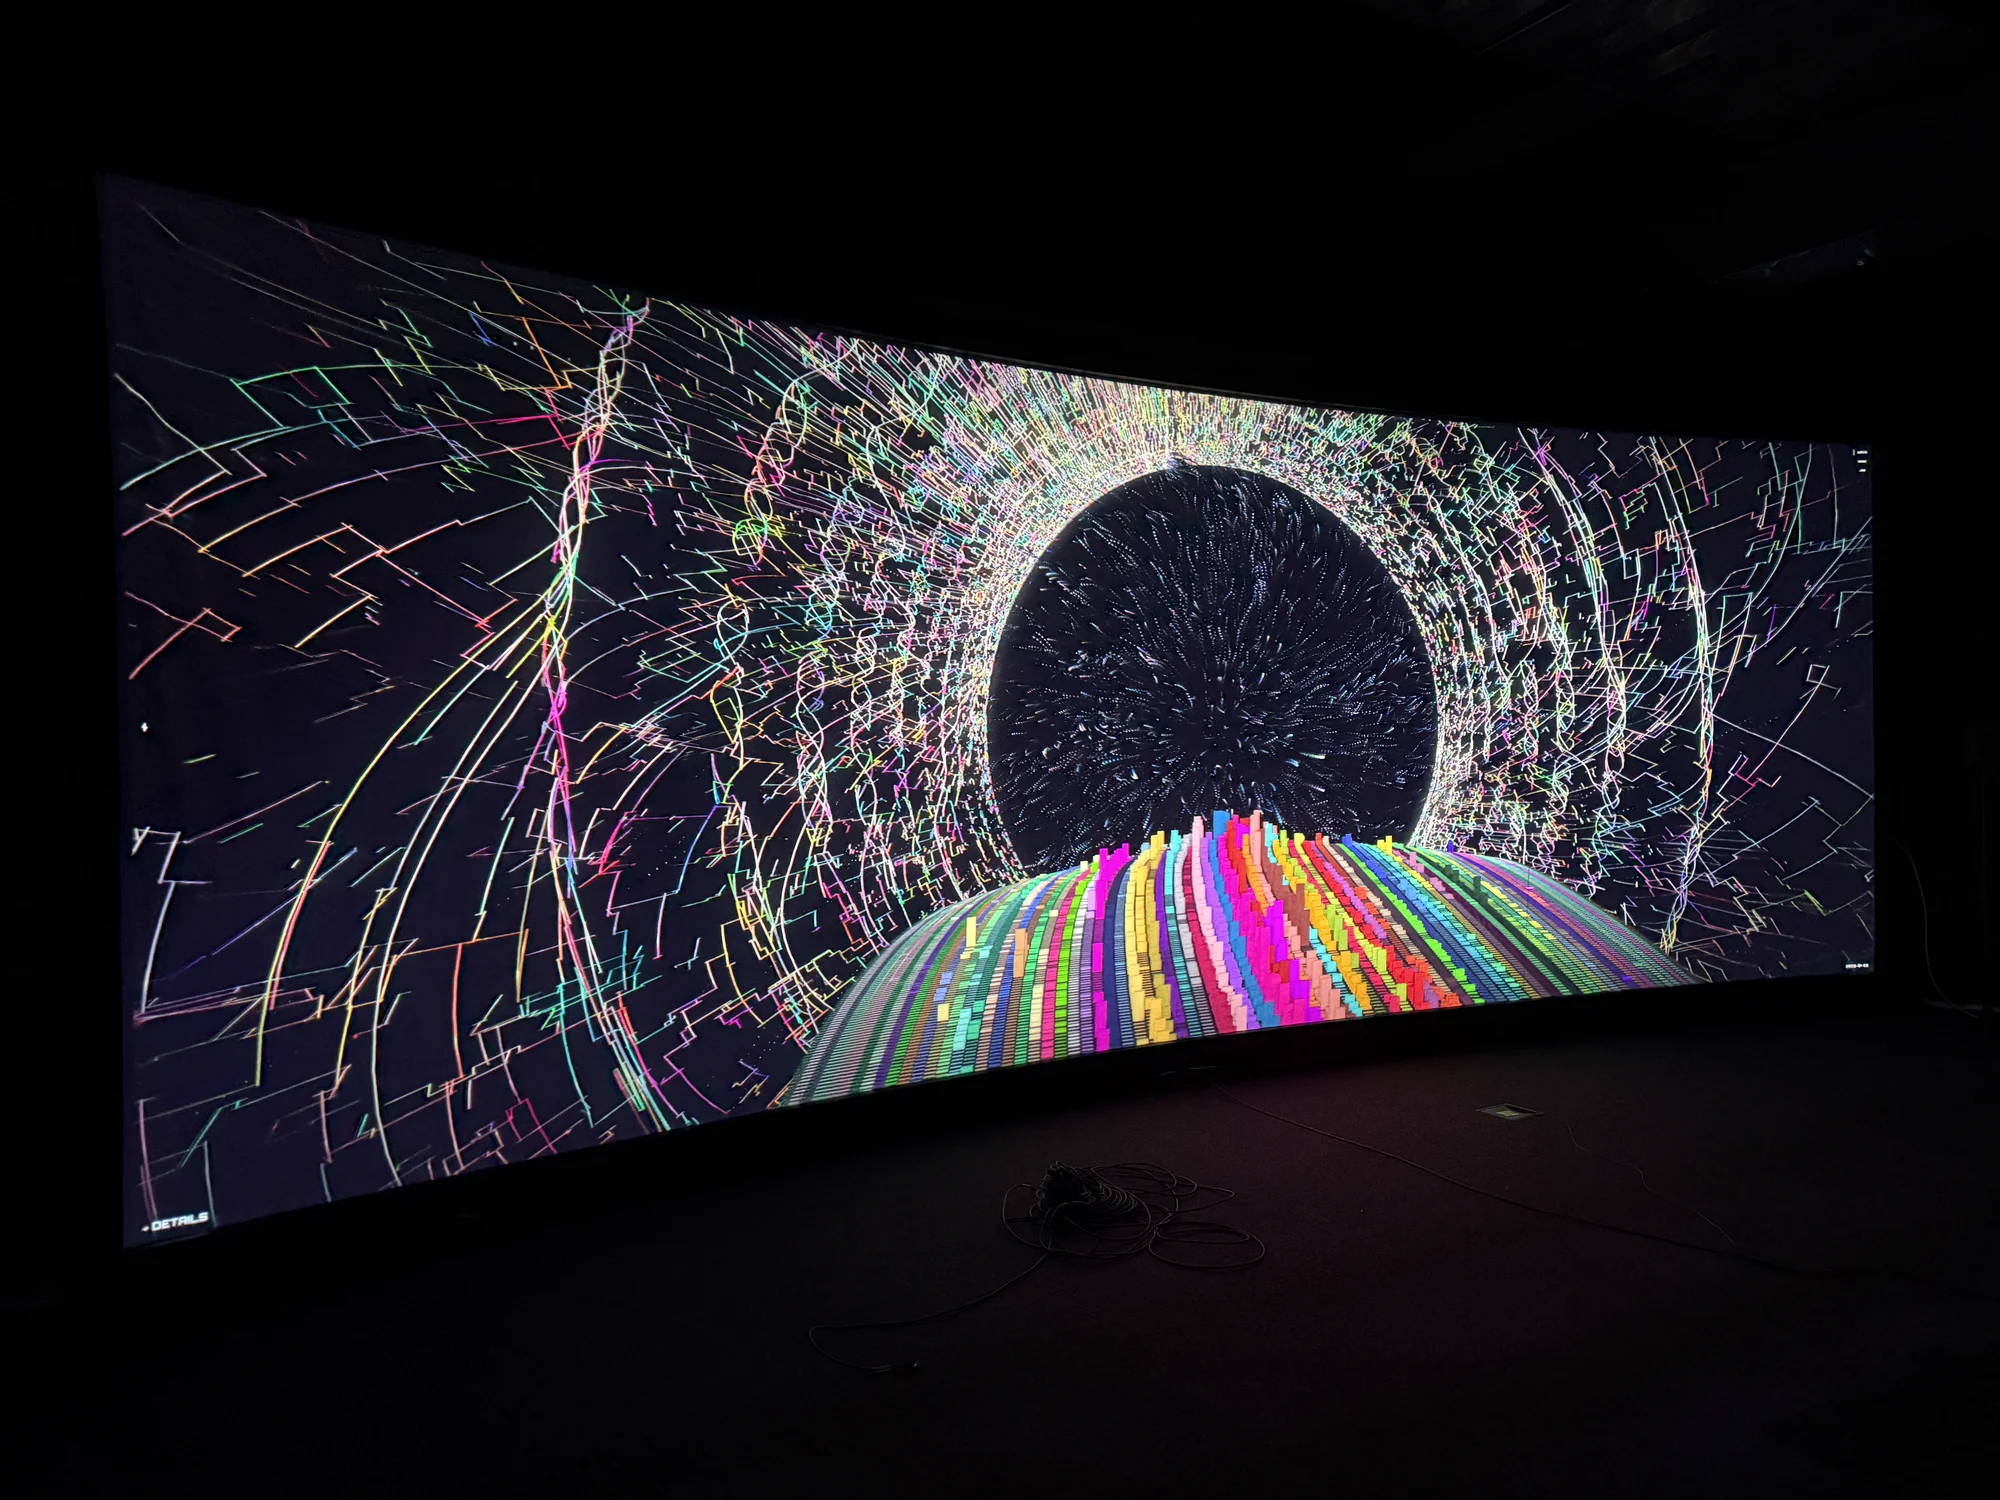
The output may become a still artwork, motion sequence, interactive WebGL piece, projection layer, LED environment, or installation surface.
Expression cannot detach from evidence
Composition, color, movement, and abstraction are designed around the relationships, uncertainty, bias, and scale present in the data.
What gets built
A data-led visual system: source review, mapping logic, code, rendered media, and interpretation aligned from the start.
- Source and structureReview of fields, relationships, provenance, gaps, scale, and the stories the data can responsibly carry.
- Mapping logicRules for translating variables, networks, time, rhythm, density, and uncertainty into form, color, motion, or interaction.
- Visual directionArt direction for static artwork, animated sequences, realtime graphics, interactive visualization, or spatial media.
- Custom pipelineData processing, rendering, WebGL, GLSL, Python, JavaScript, or export workflows matched to the final context.
- Public interpretationConcise notes that explain the source material, the visual rules, and the boundary between fact and artistic translation.
Data art and visualization examples
Data translated into public-facing form across science, health, fashion, mathematics, and network culture.